For releasing it somewhere where people can use it with or without the emulator:
Make a GitHub release, mark it as an alpha version (i.e. tag it as less than v1.0.0, e.g. v0.1.0) and then you have the option to upload additional files and you can upload the .bin as an aditional file (and don’t forget to mark the release as a prerelease).
Like I did in Physix:
Sorry if you already knew that, I find that knowledge about GitHub varies drastically even with experienced programmers.
Thanks for the easy to debug test case.
I just made a push that fixes this (bug in SXTH and SXTB opcodes). I’ll see if I can replicate the rendering issue on another PC. What’s your hardware like? Discrete graphics card?
EDIT: Another push. Temporarily disabled multithreaded rendering. Looks like discrete GPUs don’t like it for some reason.
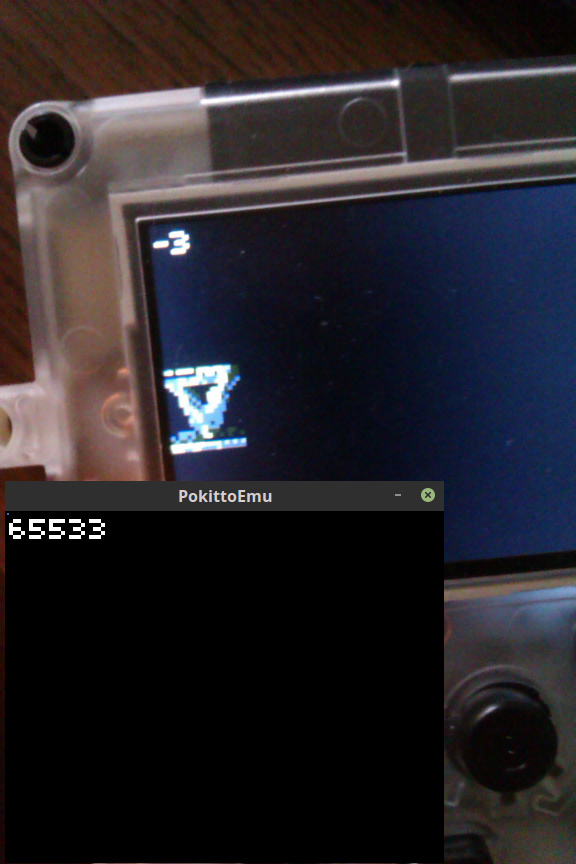
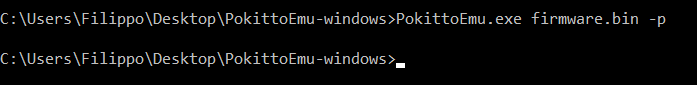
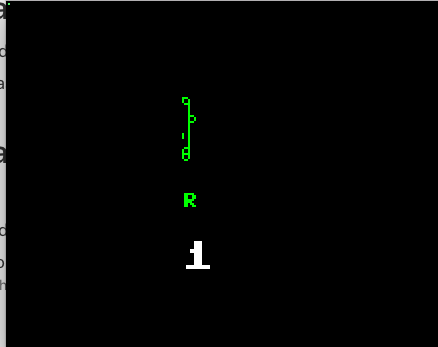
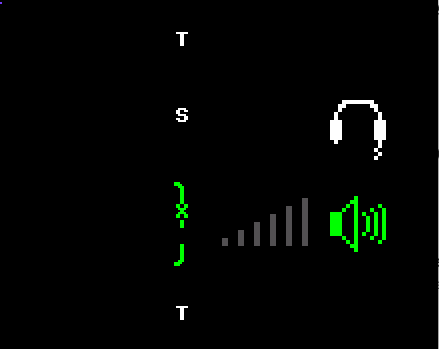
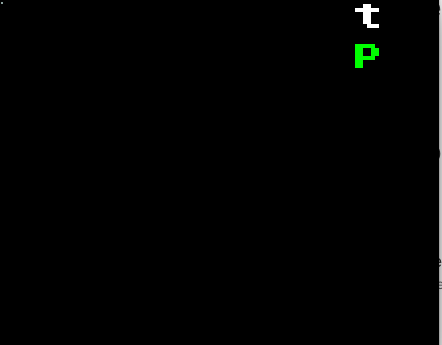
The emulator is great and I have it running on my MacBook. Have you had a chance to investigate the problem with the text? Using buttons.bin (31.2 KB), I get the following screens on my Mac.
This seems plausible.
I find people often assume char has a particular sign and don’t realise that the sign varies between compiler and platform.
(People also often assume char and either unsigned char or signed char are the same type in the same way that int is usually the same type as signed int, but actually char is a distinct type.)
char - type for character representation which can be most efficiently processed on the target system (has the same representation and alignment as either signed char or unsigned char, but is always a distinct type). Multibyte characters strings use this type to represent code units. The character types are large enough to represent any UTF-8 code unit (since C++14). The signedness of char depends on the compiler and the target platform: the defaults for ARM and PowerPC are typically unsigned, the defaults for x86 and x64 are typically signed.
While it might be a sign-related problem, it’s unlikely to be due to an assumption of whether char is signed or not since the code uses sign-explicit types (u8, s8, u16, s16, u32, s32) everywhere. Unless by mistake, I only use char for text.
To complicate things a bit, this bug only happens with bins made in mbed, which doesn’t generate elf files and makes manual debugging hard.
So I’m trying automatic debugging instead:
Right now my Pokitto is tethered to the emulator through GDB. For each instruction the emulator runs, it tells GDB to step an instruction also. Then it requests all the hardware registers and compares them to the emulator’s to find out where they differ.
Unfortunately the process is rather slow: they’re running at about 0.5Hz (2 ops per second-ish). They’ve been running in parallel for about 5 hours and they haven’t gotten to the “Pokitto” logo, yet.
Simple solution - let’s scrap mbed and recompile the problem bins in something else. :P
(It can’t do C++11, it won’t do assembly, it’s awkard for the reasons you just mentioned, and we’ve got lots of alternatives.)
Reminds me of when I wanted to find out if a 32-bit hash function produced any collisions/was guaranteed to be bijective.
I didn’t have 15GB of RAM spare, so I decided to try to write the values to a file instead.
It got through a few million values in about a day (and I couldn’t take advantage of multithreading because the synchronisation ended up being slower).
I eventually realised a way I could check without needing a full 15GB, but only after sitting through about 3-4 days of hashing. :P
It’s a shame you can’t toggle the GDB process on and off programmatically, or you could enable it after begin was over and save yourself a few (hundred) hours.
I could make it run until it hit a breakpoint and start stepping from there, but since there’s no elf file, there are no symbols, I can’t tell where begin is, I don’t know where to put the breakpoint. >_<
Perhaps if you traced all the call and return instructions you could build a sort of function map and make an educated guess based on size of each function and the order of calls?
The difficult part is that you’d have to guess what had been inlined (unless you can turn off all optimisations).
After 3 days of non-stop running the emulator and the Pokitto tethered to each other, the bug was found!
It was a copy+paste bug in the code that aligns signed 16-bit memory reads.
I just uploaded a new release build.
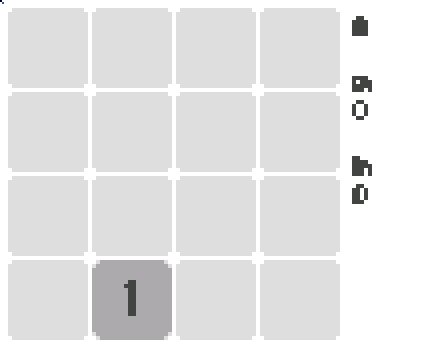
This fixes @drummyfish’s 2048 and @aus’s buttons.bin… and probably a whole lot of other things as well.
One more change: @HomineLudens: the profiler now writes to a file (hotspots.log) instead of STDOUT so that it can be used in Windows.
This has the advantage that the hotspots can be easily piped into addr2line like this: cat hotspots.log | addr2line -e file.elf
(On Windows that would be type instead of cat, I think).